What Is MTF and Why Should You Care?
Ever wondered what makes one lens sharper than another? Why do some cameras capture crisp detail while others feel... a little soft?
Welcome to the world of MTF – Modulation Transfer Function — the hidden metric behind how your lens really performs.
1.What Exactly Is MTF?
MTF measures how well a lens transfers contrast at different levels of detail from the object to the image. It’s like a report card that shows how sharp and accurate your images will be — especially for fine details.
In simple terms: MTF tells you how well a camera “sees” small things.
2.Understanding Spatial Frequency: The Key to Image Detail
Before diving deep into optical performance and MTF (Modulation Transfer Function), it's essential to understand a core concept: spatial frequency.
1.What is Spatial Frequency?
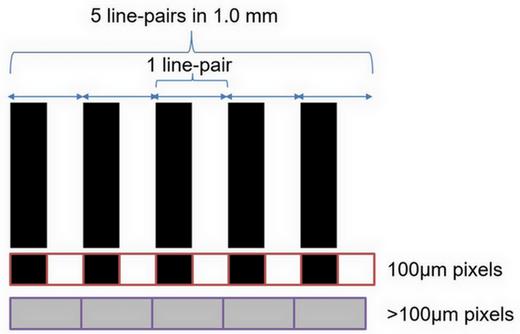
Spatial frequency refers to how often patterns or structures repeat over a given distance. In simpler terms, it measures how much detail is present in an image. It's commonly expressed in units like cycles per field of view (FOV) or line pairs per millimeter (lp/mm).
A Simple Analogy: Zebra Stripes
To visualize spatial frequency, imagine looking at a zebra:
-
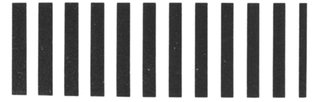
Wide stripes = Low spatial frequency
These represent large, broad shapes that don’t change rapidly across space.

-
Thin stripes = High spatial frequency
These represent fine details that change rapidly from one point to the next.
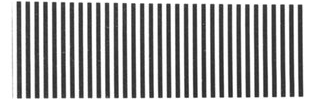
This analogy helps clarify that high spatial frequency means more detail packed into the same space, while low spatial frequency means less detail.
2.How Is It Measured?
Spatial frequency is usually measured in:
- Line pairs per millimeter (lp/mm) – commonly used in lens and sensor testing.
- Cycles per field of view (cycles/FOV) – useful for system-level analysis.
In simpler terms, MTF (Modulation Transfer Function) measures how effectively a camera captures fine details. The term “wellness” refers to the sharpness of the captured image — a sharper image indicates better reproduction of small objects.
3.What Makes an Image Look Sharp?
Sharpness is a balance between resolution and contrast — it's not just about how many fine details an image contains, but also how clearly those details are defined.
High resolution means more detail, but without good contrast, those details can appear soft or blurry. Likewise, a contrasty image with low resolution may look punchy but still lack the fine structure and clarity needed for true sharpness. True sharpness requires both.
- Resolution – How many fine details are captured (pixels, line pairs, etc.)
- Contrast – The difference in brightness between details (light vs. dark)


Sharpness = Resolution + Contrast
Understanding MTF Charts: How to Read and Interpret Them
When evaluating a camera lens, sharpness is often the most discussed feature — and one of the most powerful tools to quantify sharpness is the MTF (Modulation Transfer Function) chart. But to get real value out of these charts, it’s important to understand what they show and how to interpret them.
1.What Are MTF Charts?
MTF charts provide a graphical representation of how well an optical system — like a camera lens — can reproduce contrast and detail (resolution) at different points across the image. There are two main types of MTF charts:
1. MTF vs Spatial Frequency
This chart evaluates the contrast transfer capability of the lens across different levels of detail — regardless of image position. It shows how well fine patterns are preserved from object to image.


Interpreting the Axes (MTF vs Spatial Frequency)
- Y-Axis: Represents contrast or “how well we can see” — a higher value means better contrast reproduction.
- X-Axis: Represents either spatial frequency (for detail level) or distance from the image center (for consistency across the frame).
Diffraction Limit: The Benchmark
- In the above MTF chart, you’ll see a black line representing the diffraction limit — the theoretical maximum contrast a perfect lens could achieve at each spatial frequency.
- As spatial frequency increases (meaning more fine details), this line naturally slopes downward, indicating that even a perfect lens loses contrast at very high resolutions.
- Real-world lenses, with their manufacturing imperfections, always perform below this diffraction limit.
Interpreting the Color Lines
- Blue Line: Performance at the center of the image frame (typically the sharpest region).
- Green Line: Performance somewhere between center and edge.
- Red Line: Performance at the corners, where aberrations tend to degrade quality the most.
2. MTF vs Distance from Image Center
This chart shows how consistently the lens performs from the center to the edge of the image frame. It reveals how image quality holds up across the entire field of view.

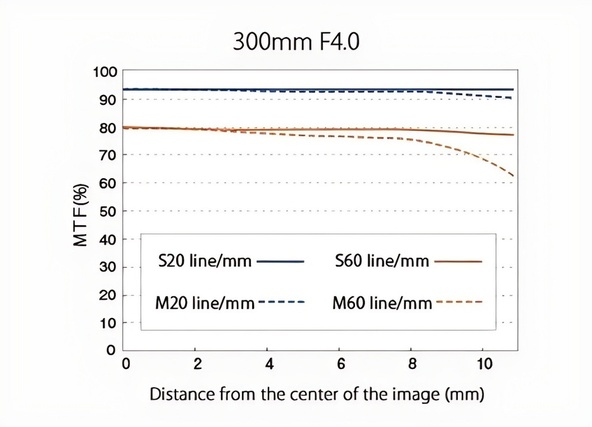
A Note on Spatial Frequency in MTF vs Distance from Center Charts
In MTF vs Distance from Center charts, the x-axis does not represent spatial frequency. Instead, it represents distance from the center, and the spatial frequency (line pairs per mm) used is kept constant throughout the chart.
Usually, two frequencies are plotted:
- 10 lp/mm to represent contrast
- 30–40 lp/mm to represent resolution
This dual-frequency approach allows you to see how both contrast and resolution behave across the frame.
Key Takeaway
As more line pairs are packed into the same unit of space (higher spatial frequency), the system’s ability to reproduce them accurately decreases. That’s why MTF is so crucial — it shows not just whether the detail is captured, but how well it’s captured in terms of contrast and sharpness.
Here's the kicker:
You can’t compare MTF charts from different brands. Different companies use different methods, algorithms, and test setups. Always compare lenses within the same manufacturer.
Final Thoughts: Why MTF Matters
If you're choosing between lenses, especially for high-precision tasks (like microscopy, surveillance, or professional photography), MTF charts offer a data-backed way to judge image quality.
They’re not perfect. But they give you a solid “ballpark” estimate.